As an exercise to try and engage students with map projections, I decided to see if I could teach them to make a globe. Globe-making is an ancient art that traditionally required a tremendous level of skill, but nowadays I figured that it would be quite easy to do with a simple Python script.
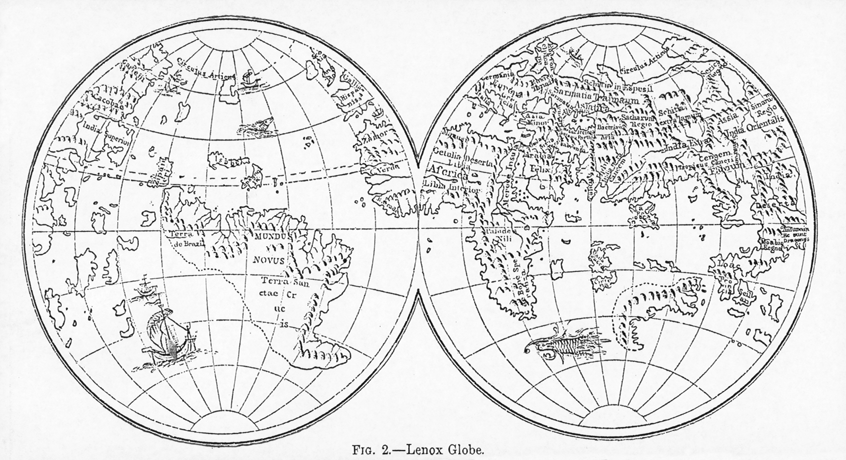
(According to Wikipedia): Terrestrial globes are believed to have first appeared as early as the 3rd Century BC; around the time that Greek Astronomers established the world to be spherical. The oldest globe still in existence is from 1492, and was constructed in Nuremberg, Germany. A later globe, the Hunt-Lenox globe dates from around 1510, and is one of only two historic maps known to actually contain the phrase “Hic Sunt Dracones” (Here Be Dragons).
Though modern globes are typically made with moulded plastic, I think that the old-fashioned method is much more interesting, so this is how we will approach it here.
I set out to do it using the OGR, PyProj, Mapnik and PIL Python libraries, with the intention of rendering each gore (section of the globe) separately, and then using PIL (Python Imaging Library) to stick them all together at the last minute. This approach is required as Mapnik (like most GIS/mapping software) doesn’t support interrupted projections, which is effectively what you want if you are going to make a Globe. For the purposes of this demo I have used data from Natural Earth, but it will work with any data whatsoever.
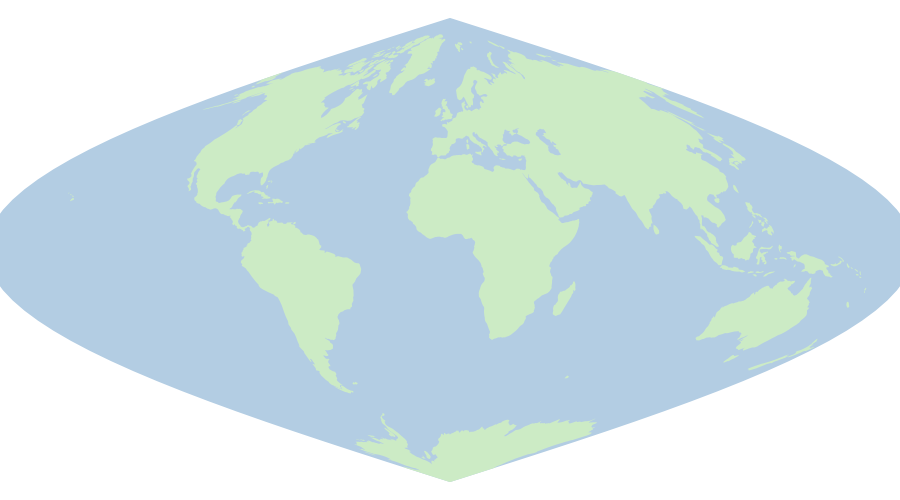
There are many different approaches that you could take to making your gores, though in essence you want to end up with a spherical, interrupted map projection that you can cut out and then stick onto a ball. Probably the easiest way to achieve this is using a Spherical Sinusoidal Map Projection:
To do this, you firstly want to decide how many gores your globe is going to be comprised of. As a general rule, the more the better, up until about 12 gores, after which it starts to look a bit poor because there are too many joins and becomes too fiddly to put together neatly.
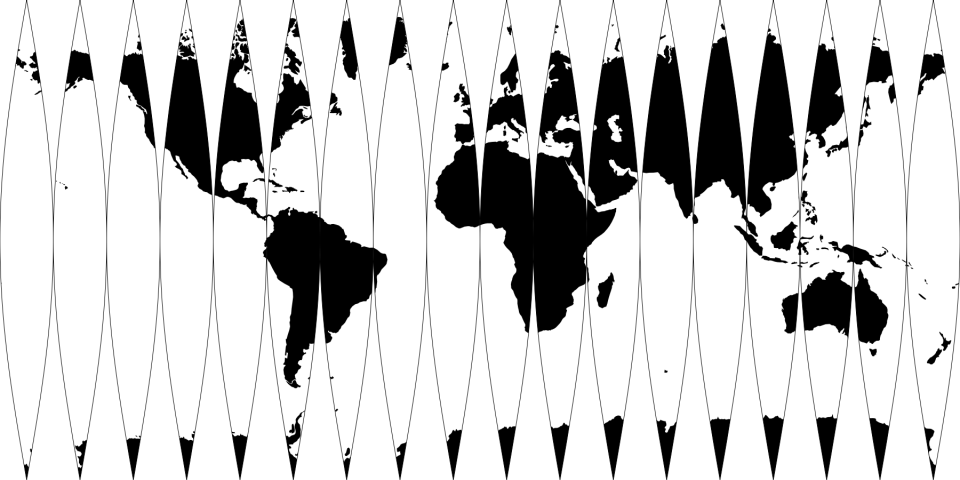
I find that 6 gores is a pretty good balance of appearance and fiddlyness.
Once you know how many gores you want, you need to work out the width of each one, which is as simple as dividing 360 by that number. For example, in the case of 6 gores, each one will be 360 ÷ 6 = 60 degrees wide. It it then a matter of making 6 maps, each 60 degrees wide, and each projected in a Spherical Sinusoidal map projection:

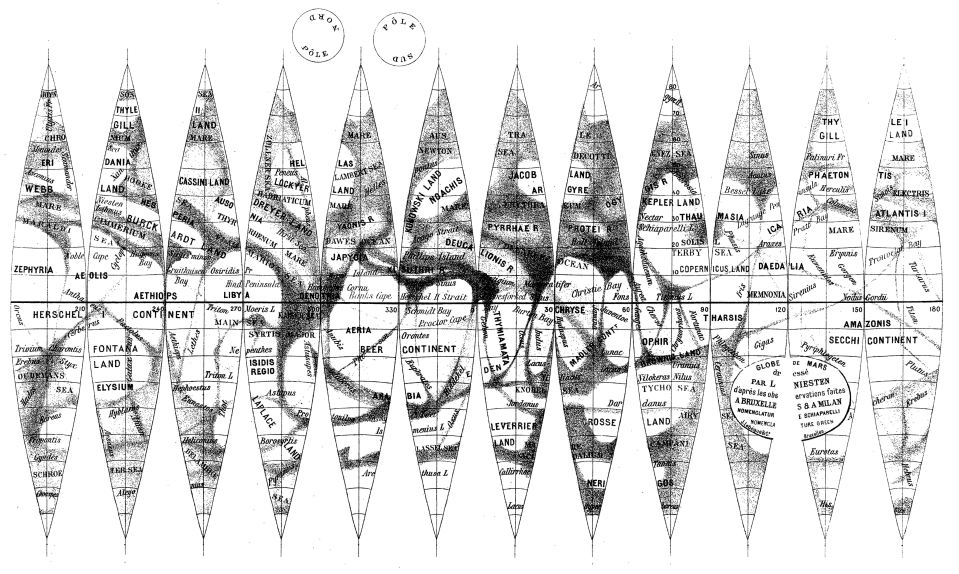
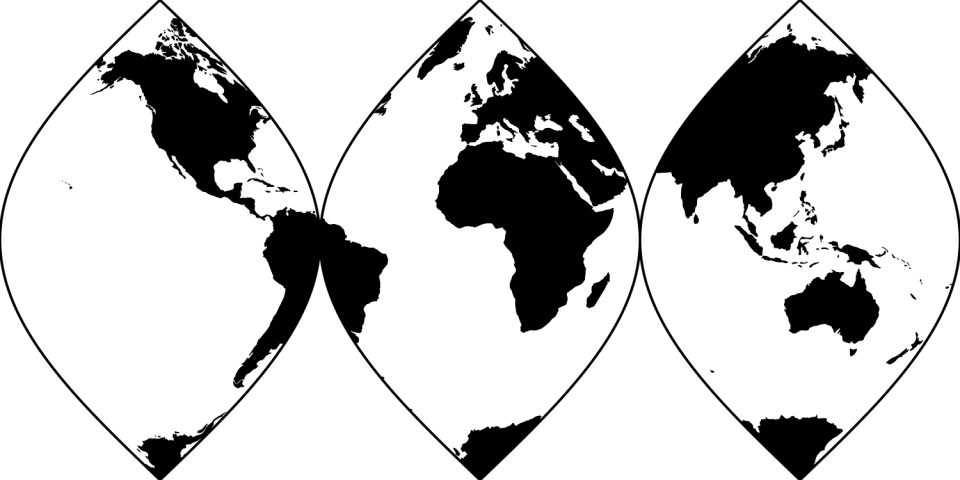
The trick to this is that each time you project one of the gores, it needs to be using a Spherical Sinusoidal projection for which the central meridian is set to the centre of the gore. If you don’t remember to do this, you will end up with something like this:

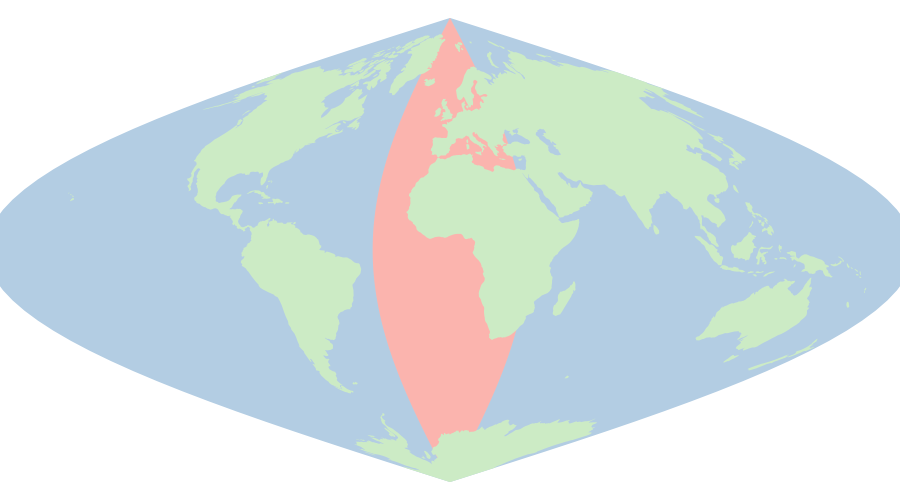
Another ‘gotcha’ is that, because the Natural Earth data stretch right across the Earth (from -180 to 180 latitude), reprojecting them in this way will lead to some very odd results :

I came across this issue in development, as is detailed in this entry on the GIS Stack Exchange. To avoid this, you need to calculate the shape of the gore (I used PyProj for this), and then clip the data against it before you project, thus ensuring that no data can ‘fall off the edge of the world’.
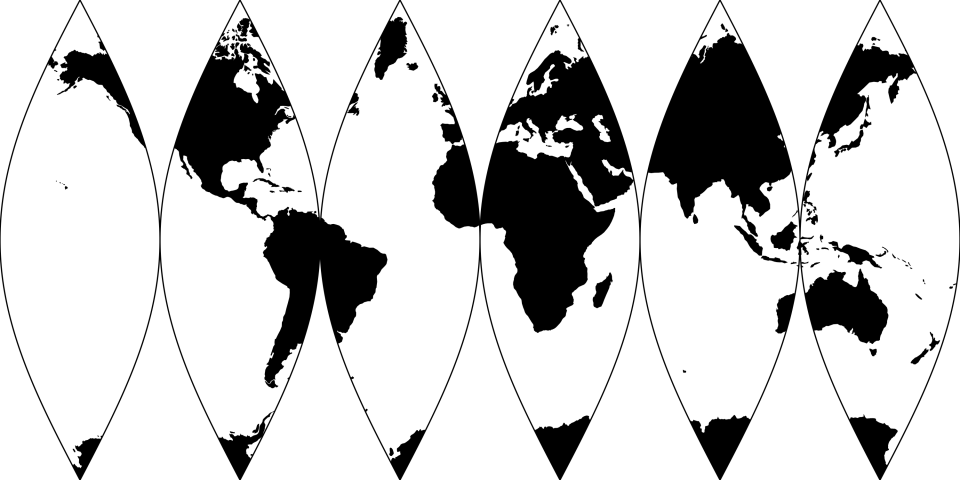
To handle the reprojections and the rendering of the map to an image, I used Mapnik, which is my favourite map rendering software. Once this is done, you have your gore, and simply need to repeat this at regular intervals across your dataset in order to produce a full set.
The final job of the day is to stick all of your gores together in order to make the final, cut-outable map, and this is pretty simple too: using PIL, I simply made a blank image, sized correctly to accommodate all of my gores side-by-side, and ‘paste’ them onto it. Voila, you have some gores!
Now for the fun bit, get a ball (I reckon the polystyrene ones that you can get from art shops are the best bet), print off your map (at the right size for your ball…!), cut it out and stick it round the ball with the pointy bits joining at the poles. If you’re feeling fancy you can even cut out a couple of small disks to cover the poles, which tend to get a little messy in the sticking process.
Congratulations, you are now a successful globemaker! Quit the day job, send in your application to the Guild of Master Craftsmen and set up shop.
[Picture to follow!]
The Python script to create a globe is available open source on GitHub, so feel free to take a look / use it to make your own!
Also, if you haven’t visited it before, GIS Stack Exchange is a great resource for any questions that you might have about GIS / GIS development, and is great to support by answering questions if you ever have a spare five minutes.
